Tag: investing

Weighted Average Cost of Capital

Weighted Average Cost of Capital or WACC is a measure of the company’s cost of capital across all sources like equity, debt and preference shares. It’s the number which is used as the discount rate in a dcf model.

It represents the minimum return that a company must earn to satisfy it’s owners, lenders and creditors. It’s purpose is to determine the cost of capital based on the proportions of debt and equity in the total capital, hence the word weighted is used.

It has two components, cost of debt and cost of equity. It’s a common misconception that there’s no cost of equity. But the expected return by the shareholders is considered the cost of equity from a company’s perspective because if shareholders don’t earn that amount, they can just sell the shares. Cost of debt is basically the interest that is payable on borrowings.

To calculate the cost of equity, we’ll use the capital asset pricing model or CAPM.
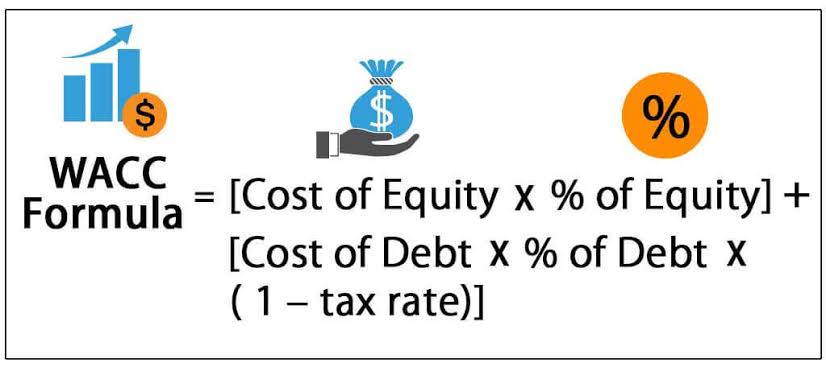
Formula for WACC:

Credits : Wallstreetmojo.com

Calculating cost of equity :

Cost of equity = Rf + B*(Rm-Rf) Here, Rf is the risk free rate. Which is the return that can be earned in riskless securities like govt. bonds. B is the stock’s beta, also knows and stock volatility. Rm is the annual return of the whole market.

For india, Risk free rate can be used as 6 percent. (Rm-Rf) is known as equity risk premium, which is a very long topic in itself which I won’t be able to articulate properly. But you can use a figure of 7.5 percent as Rm-Rf for Indian markets.

Calculating cost of debt :

1) calculate cost of debt by taking a company’s interest expense for the year, and dividing it by the company’s total debt(both short term and long term). Multiply it by 100 to get the percentage.

2) Then calculate effective tax rate by taking the company’s income tax expense and dividing it by income before tax. Multiply it by 100 to get the percentage.

3) As interest is tax deductible, to reflect that. The cost of debt calculated in the first step is multiplied by (1-t). Where t is the tax rate calculated in step 2. This is the final cost of debt.

WACC of Wipro

Cost of debt

  1. Interest expense = 4861000
  2. Short term debt = 73202000
  3. Long term debt = 4840000
  4. Cost of debt = 4861000/(73202000+4840000) = 6.23%
  5. Income tax expense = 24938000
  6. Income before tax = 122743000
  7. Effective tax rate = 24938000/122743000 = 20.32%
  8. Cost of debt(1-t) = 4.96%

Cost of equity

  1. Risk free rate = 6%
  2. Beta = 0.55
  3. Cost of equity = 6% + 0.55*7.5% = 10.13%

Final WACC Calculation

  • Total debt = 78042000
  • Market cap = 1974000000
  • Total = 78042000 + 1974000000 = 2052042000
  • Weight of debt = 78042000/2052042000 = 3.80%
  • Weight of equity = 1974000000/2052042000 = 96.20%
  • WACC = weight of debt*cost of debt(1-t) + weight of equity*cost of equity
  • = 3.80%*4.96% + 96.20%*10.13%
  • = 9.93%

In the above example, all numbers are in thousands.

DISCOUNTED CASH FLOW MODEL

The following post is in continuation with the previous one, so I recommend that you read it first.

DCF is a stock valuation model which uses the present value of future cash flows of a company to assess the present fair/intrinsic value of a company’s share.

Translating the above paragraph from finance nerd to nerd: it means that if we discount(opposite of compound) the future cash flows of a company, and thus calculate their present value. We can use that data to basically calculate the intrinsic value of a share.

The major assumption of this model is the time value of money, which says that money today is worth more than the same amount tomorrow.

The model has alot of pros, and the results are a pretty good indicator of a company’s value. But the major con is, that the more we go into the future with our predictions, more inaccurate the model gets.

The method:

1) Predict future free cash flows: typically future free cash flows are predicted 5-10 years in the future and this is done by analysing past free cash flows of the company. This is where your creativity as an investor comes into play. Try to keep your predictions conservative.

2) Calculate the discount rate: the discount rate in a dcf model is the WACC. I’ll talk more about wacc in the next post.

3) Calculate the terminal value: terminal value(tv) is the value of the business beyond the predicted cash flow period. It assumes that the business will grow at a set growth rate forever. It’s formula is: [CF*(1+g)]/(r-g) here, CF is the last predicted cash flow, r is the discount rate/wacc and g is the terminal growth rate.

4) Discount the cash flows and the tv to present value: now the cash flows and tv are discounted back to present value. This is done using the formula:

Credits:wallstreetmojo.com

C here is the predicted cash flow, r is the WACC and n is the number of periods. For eg: for the 5th year, n=5.

For the TV, value n is the same as preceding year’s value of n. For eg, if I’ve predicted cash flows of 10 years, then to discount tv, the formula would be: TV/[(1+R)^10]

5) Calculate the equity value: calculate enterprise value by summing all the discounted cash flows and the discounted tv. Add to it company’s cash balances and subtract the long term debts of the company. The number obtained now is the equity value. We have subtracted the debts because the purpose was to arrive at a figure which belongs to the shareholders only.

6) Divide equity value by shares outstanding: dividing the equity value by the amount of shares outstanding will finally give us the intrinsic share price of the company. Phew, that was hard af!

INTRO TO FUNDAMENTAL ANALYSIS

Fundamental Analysis in the simplest of terms can be defined as the analysis of a company’s financial statements, the economy, the competition, and the overall market.

It can have quite a few objectives, depending upon the user. But our focus being the stock market, I’ll talk about the use of fundamental analysis to calculate the intrinsic value of a stock.

Fundamental analysis sharply contrasts technical analysis. The former is more suited for a long term strategy, and uses an analysis of statements. Whereas the latter is more of a short term strategy, and uses past price movements to forecast future ones. It’s more concerned with investor sentiment.

Investors usually use a mixture of both technical and fundamental analysis to pick stocks and make a balanced portfolio. Technical analysis can be used with a fundamental analysis to time entry and exit in the market.

Fundamental analysis uses models like discounted cash flow(dcf) and dividend discount model(ddm)/ Gordon growth model(ggm). Both of these fall under absolute analysis and can be used to arrive at intrinsic values.

We can use ratios like pe ratio, debt equity ratio, and price to book ratio to compare a company with it’s peers in the same industry. This is called relative analysis. It helps to quickly determine whether the company is worth an in depth analysis or not.

In the future posts, I’ll talk in more detail about the absolute models and will also try to provide a step by step guide on how you people can also make your own basic models. Stay tuned!